Posts

Showing posts with the label how to create a graph in excel

How to create a unique target chart in Excel - Video tutorial

Image

How to create a unique target chart in Excel

Image
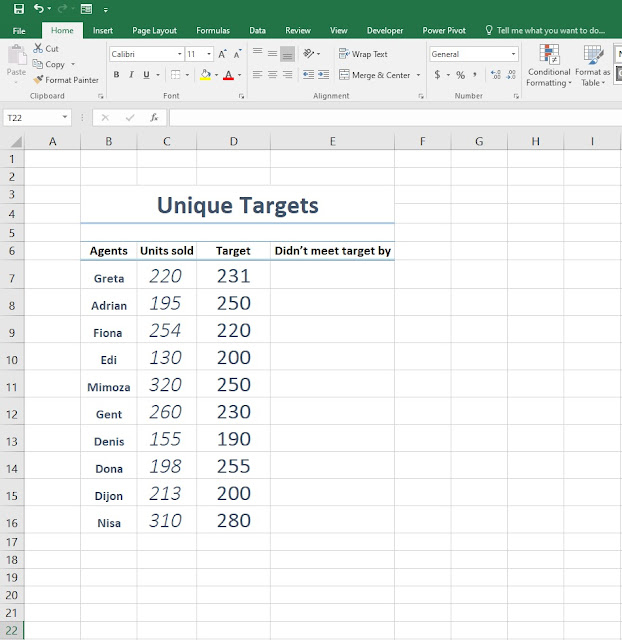
Hello everyone, and welcome back to another tutorial where this time we're going to create a  unique target chart using Microsoft Excel.  If you've followed the previous posts you will get the idea on what we will try to do and shouldn't have any difficulties whatsoever.    1.  First step, fill in the cells with the information given bellow. Once we're finished with this tutorial you can create the table based on your needs and preferences.    2. Step two, by now you probably noticed the headers consisting the Agents, Units sold, Target and Didn't meet target by.  What you will do now is under the Didn't meet target by cell type the formula =MAX(D7-C7,0) in order to avoid the IF function we've added MAX instead, where we set 0 as our number limit so we don't have net results like -12, -25, -36 etc.     3. Step three, we've added another header Target overachieved where we will type the formula...

In cell vs target chart - video tutorial

Image

In cell vs target chart in Excel

Image
Hello everyone and welcome to another tutorial where this time we're going to follow through our last exercise where we tweak some things and finish it off with a chart.     1 Step one, select the columns from A to T (or to any column you feel it's far enough), Right Click > Column width and set it to 17.      2.  Step two, fill in the cells with the order you see in the picture down bellow.    3.  Step three, under  Conditional Formatting format the new rule and under Value > Maximum make sure you select the cell right beside Goal.  You probably know by now how you're supposed to format your new rule. If you're new to this tutorial then please visit our last exercise:  https://letslearnitnow.blogspot.com/2020/04/how-to-create-actual-cell-vs-target.html    4. After you've successfully created the new rule, please do edit and format the table so it will have that clean l...

How to create an in cell vs target graph in Excel - Video tutorial

Image

How to create an actual cell vs target graph in Excel

Image
Hello everyone and welcome to another tutorial where this time we're going to see how you can make a very quick and simple actual cell vs target graph in Microsoft Excel in just a few easy steps.      1.   First step, fill in the cells as seen on the picture bellow and write down the benchmark of units sold on the target or goal cell. Now that we have the benchmark of 100 units sold as our primary goal, head over to the actual cell and write down a random or in your case the actual number of units sold. Once you've done that on the graph cell type =D5  as seen on the picture where we will use the formula to show the graph in the next step.     2. Step two, once you click enter you will notice on the graph bar the progress is 50 units of the 100 target units sold. To add the graph go to Conditional formatting > New rule     3. When the New Formatting Rule window opens head over to Format Style and set it ...

How to use math formulas in Excel

Image
Welcome to another tutorial today where we're going to learn how to use simple and basic math formulas in Excel. With a step by step guide we will go through some basic math formulas and how to use them in your day to day life using Microsoft Excel.    1. Before we start using the math formulas, firstly, I've created a field of useful information as my input that is going to help you orientate on where and when you should use the formulas. As you can see from the picture below, I've created a simple sales table representing the number of smart phones sold. So, open a blank workbook and write down the necessary information as in the picture below.     2. Once you've wrote down all the information, you'll notice that the column just above the manufacturer brand is empty, that's because the column is not wide enough to fit large words. In order to make that word completely visible you could either reduce the font size, widen the column or in my ca...

Video showcase on how to create a graph chart in Excel

Image

How to create a graph chart in Excel

Image
 Hello everyone and welcome to another tutorial where this time I'm going to show you a simple step by step tutorial on how to create a graph in Excel in just under a minute.   Firstly , before you start open Excel under a blank workbook and for a more simplified execution of this task as an example I'm using here city names and their population, that's what our graph is going to consist of.       1.  First step what you're going to do is on the A1 to D1 column   write the city names that you would want to use. After you've done that, on the A2  to D2 column write the population of those cities as in my example.     2. Step two, (make sure you've selected all the columns from A1 to D2 ) go to Insert and select the desired graph that you would want to use. In my case it's Insert statistic chart.  As you can see from the picture below, on the red rectangle you can select different graphs and charts to choose f...